These data were originally supplied by the USDA Natural Resources Conservation Service (NRCS) about agricultural conservation practices supported by USDA. This is the most reliable and uniformly available dataset to the member states of the Hypoxia Task Force (HTF) on conservation activities available and are referred to here as “common data”. These data were first culled by pulling out “Practices Providing Water Quality“. Data were extended through a grant by the Walton Family Foundation to include information suggested by the HTF Nonpoint Measures Workgroup in their May 2018 report. Extensions were done using a set of assumptions developed by Dr. Reid Christianson and the conservation practice tracking team through SERA-46 in support of the HTF. In addition to extending these data, quality control was done to find and replace data that may have been mis-keyed on entry. An example would be practices entered with non-standard units like feet, when the typical unit is acres. The procedures for this approach can be found in the appendix of this Summary Report, though generally consist of developing a relationship between funding rates for the location and year and the standard unit (e.g., typical $/ac, which can be used to calculate acres).
Data displayed below was compiled in Microsoft Excel, and is being presented using Tableau Public. Original data files from the NRCS can be found here.
The data display below is showing, by 8-digit watershed, conservation practices influencing water quality. Data include area treated by specific conservation practices, and the life of these practices has been accounted for – meaning a selected year shows practices that may have been put in previously, but are still active. Not all practices with native units other than acres have been “converted” to acres treated, as these relationships are not yet fully understood. Further, a water quality benefit has not been developed for all practices included in the list. Additionally, a set of Lessons Learned was developed in 2018 while working with two pilot states (Indiana and Arkansas) during framework development.
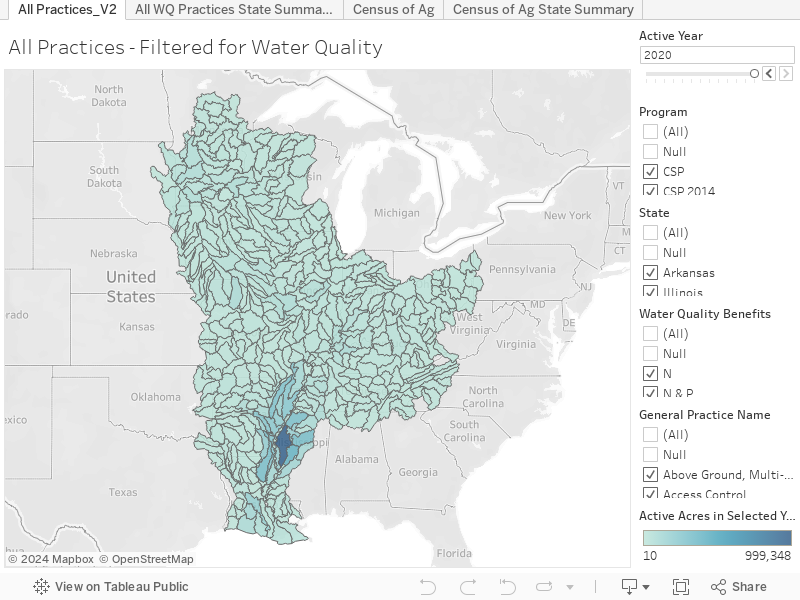
To cite these data, please use:
Christianson, R. 2021. Common Data for Hypoxia Task Force Member States through 2020 [spatial data – unpublished]. Retrieved from https://public.tableau.com/app/profile/reid.christianson/viz/HTF_NRCS_Conservation/AllPractices_V2?publish=yes.
Another common data source among all member states of the Hypoxia Task Force is the Census of Agriculture. These data are available every five years, and in 2012 this census started accounting for cover crops, tillage, and tile drainage at the county scale. These data were aggregated/parsed to 8-digit watershed scale to match other data sources.
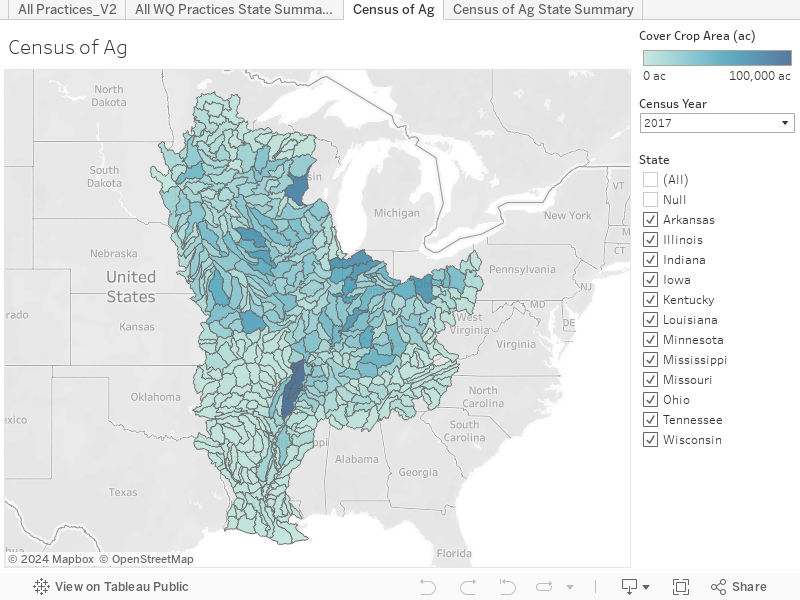
To cite these modified data, please use:
Christianson, R. 2019. Parsed Census of Agriculture Data for Hypoxia Task Force Member States – 2012 and 2017 [spatial data – unpublished]. Retrieved from https://public.tableau.com/app/profile/reid.christianson/viz/HTF_NRCS_Conservation/CensusofAg?publish=yes.